Monitoring the Weather at Home
With the “IoT” market being flooded with products, setting up a weather monitoring station at home is pretty easy, and can be done for a variety of uses. Of course setting up an outdoors weather station is the obvious idea, but my main use case for this projects was to monitor indoors as I was suspecting my AC of having a faulty PID controller. Essentially, I wanted to see how stable my AC really is.
Weather Board
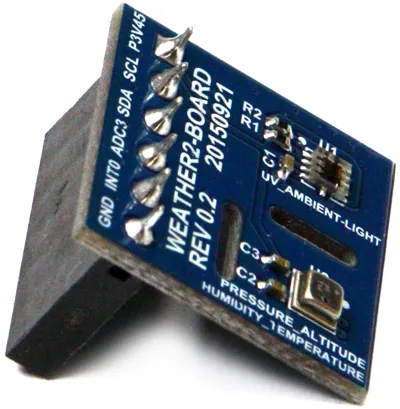
The main piece of sensing hardware for this station is the Odroid Weather Board. It is not only specifically made to work with Odroid devices, which I absolutely love and recommend, but it also has a pair of high quality sensors. The BME280 sensor provides measurements for temperature, barometric pressure and humidity, while the Si1132 sensor provides UV index, ambient light and IR measurements.
Main Board
The board is connected to a trusty Odroid C1 I had that wasn’t doing much. Connection is through a simple I2C interface. A sanity test for the board looks like this:
$ sudo i2cdetect -y -r 1
     0  1  2  3  4  5  6  7  8  9  a  b  c  d  e  f
00:          -- -- -- -- -- -- -- -- -- -- -- -- --
10: -- -- -- -- -- -- -- -- -- -- -- -- -- -- -- --
20: -- -- -- -- -- -- -- -- -- -- -- -- -- -- -- --
30: -- -- -- -- -- -- -- -- -- -- -- -- -- -- -- --
40: -- -- -- -- -- -- -- -- -- -- -- -- -- -- -- --
50: -- -- -- -- -- -- -- -- -- -- -- -- -- -- -- --
60: 60 -- -- -- -- -- -- -- -- -- -- -- -- -- -- --
70: -- -- -- -- -- -- 76 --
This output shows that both addresses 0x60 and 0x76 are active, representing the two sensors.
Dash Board
The final part is hooking the sensors up to show Pretty™ visualizations, and for that Grafana is an obvious choice. But to get the data shipped over to the dashboard we need two more parts, a script for polling the sensor for actual data, and a place to store it. Again, another obvious choice is to use InfluxDB as the main time-series database, which works natively with Grafana.
Essentially, since the C1 is a powerful device, we can run the entire setup all on the same board - sensor, database and dashboard.
Once Grafana and Influx are both installed with their services enabled, it’s time to create the Influx database
$ influx
Connected to http://localhost:8086 version 1.5.1
InfluxDB shell version: 1.5.1
> create database weatherdb
Hooking up to this database from Grafana is also straightforward.
Finally, we need a small Python script that hooks everything up together, here is the basic setup I’m using:
import SI1132
import BME280
import time
import pytz

from datetime import datetime
from influxdb import InfluxDBClient

client = InfluxDBClient(host='127.0.0.1', port=8086, database='weatherdb')

I2C = '/dev/i2c-1'
TZ = pytz.timezone('UTC')

si1132 = SI1132.SI1132(I2C)
bme280 = BME280.BME280(I2C, 0x03, 0x02, 0x02, 0x02)


while True:
    data = {
        'uv_index': si1132.readUV() / 100.0,
        'visibile': si1132.readVisible(),
        'ir': si1132.readIR(),
        'temperature': bme280.read_temperature(),
        'humidity': bme280.read_humidity(),
        'pressure': bme280.read_pressure() / 100.0
    }
    body = [{
        'measurement': 'weather',
        'tags': { 'station': 'room1' },
        'time': tz.localize(datetime.now()).isoformat(),
        'fields': data
    }]

    print(body)
    print('---------')
    client.write_points(body)
    time.sleep(10)
There are two required libraries here, one for each sensor, and in any case the full code can be found on Github at https://github.com/yuvadm/weather-station
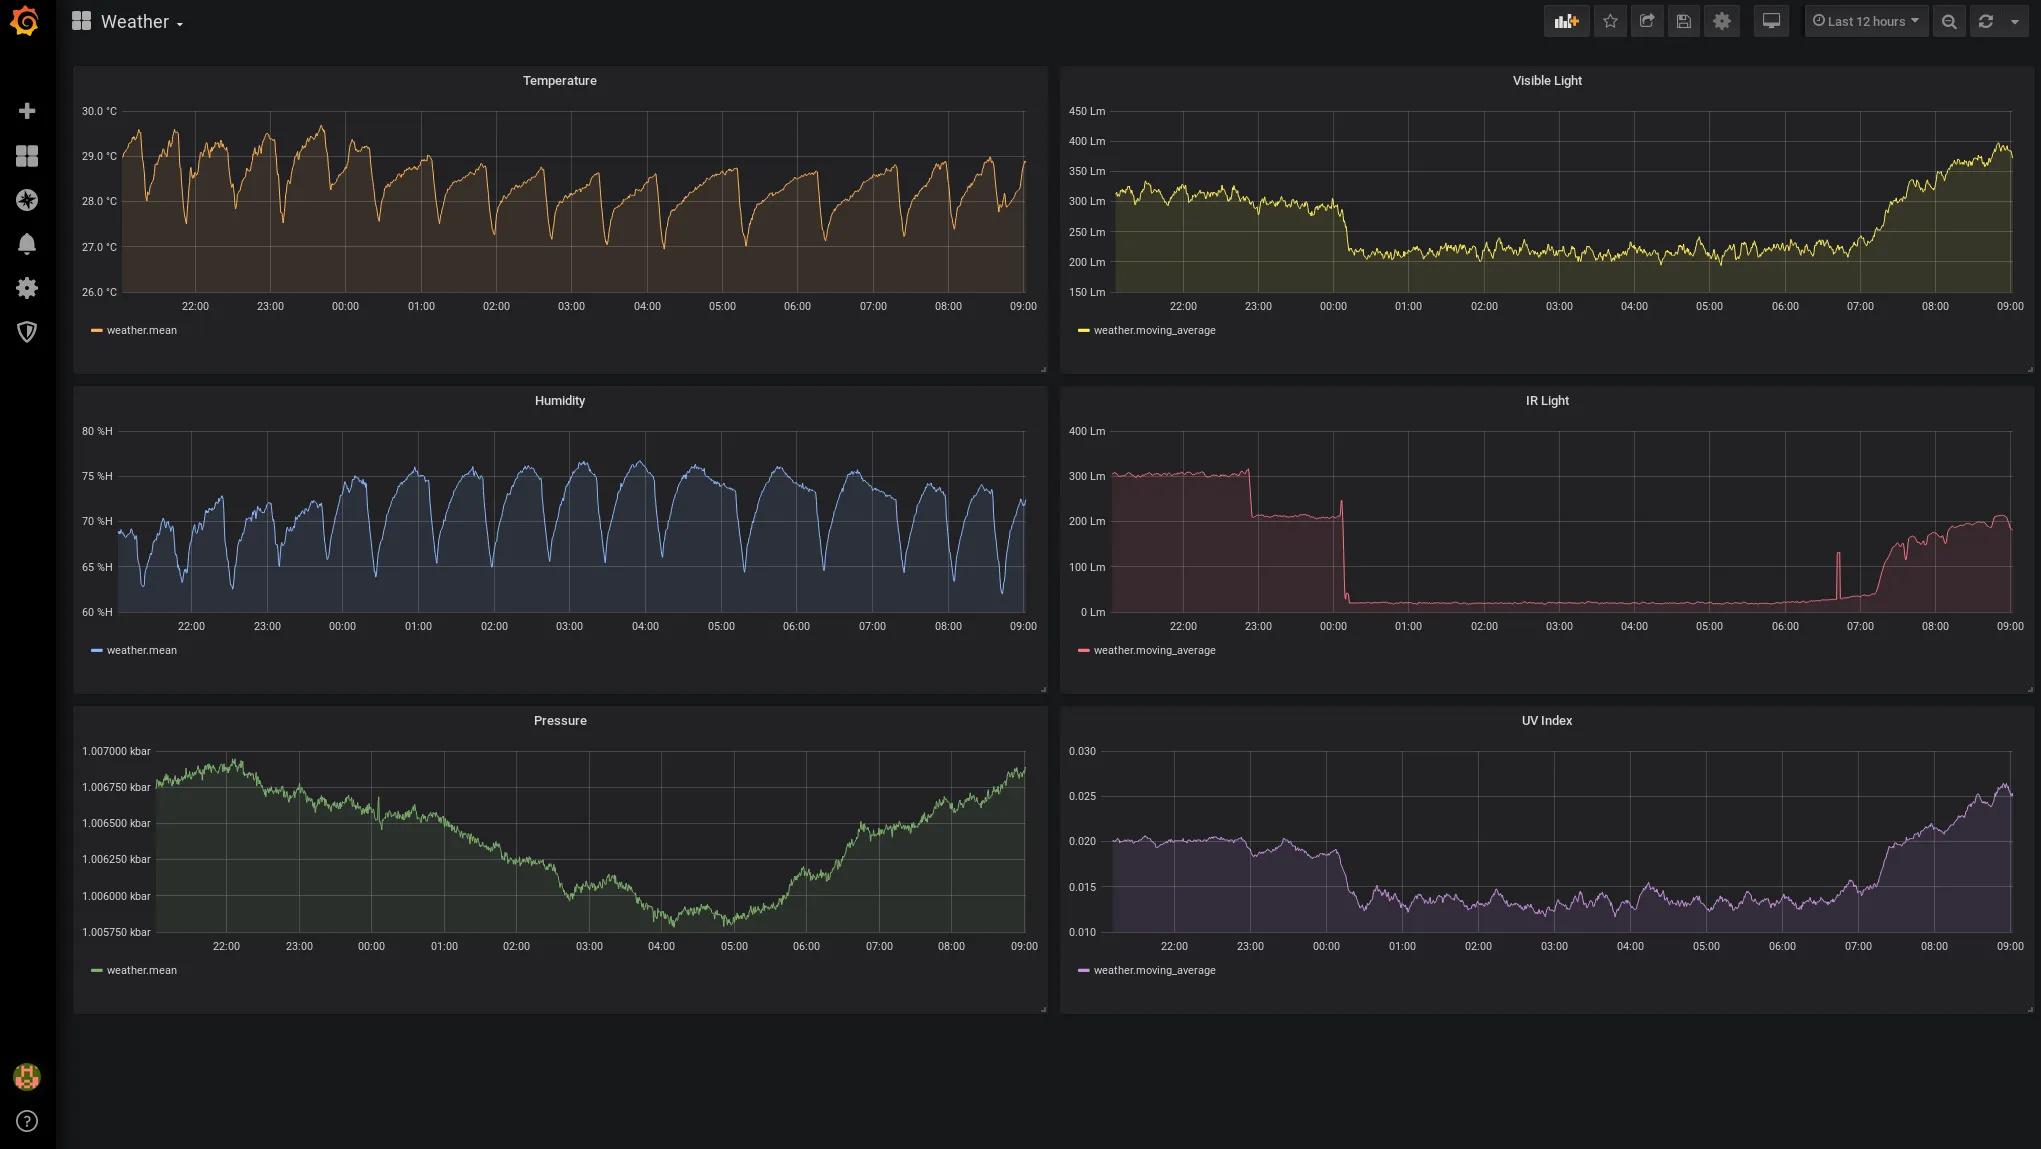
Now we can open a tmux session, run the script, and then start seeing some data flowing into Grafana! (Can you see the air conditioning PID cycles?)
Conclusion
The next step for this setup is to add more sensors around my house, possibly outdoors, that send the same data but tag it from another station, so that I can compare between what’s going on inside my apartment to how much things are bad outside.
This is your friendly reminder that the earth is literally melting, and we are in the middle of the Sixth Extinction. Maybe it’s time a write a blog post about that…